Look, let’s be real for a second. If you’re getting into real estate investing and you don’t understand ROI, you’re basically flying blind. And nobody wants to throw their hard-earned cash into a property without knowing if they’re actually going to make money, right?
Think of real estate ROI as your investment GPS. It tells you exactly where you’re going, whether you’re heading in the right direction, and if you should maybe take a different route. Without it? You’re just hoping for the best and crossing your fingers – which, spoiler alert, isn’t a great investment strategy.
Whether you’re eyeing your first rental property or you’re already juggling a few units, understanding real estate ROI isn’t just helpful – it’s absolutely essential. And here’s the thing: it’s not as scary or complicated as it sounds. I promise. By the time you finish reading this, you’ll be calculating returns like a pro and impressing people at dinner parties (okay, maybe just other real estate nerds, but still).
- What is ROI (Return on Investment) in Real Estate?
- Why Traditional ROI Formulas Fall Short in Real Estate
- The 3 Essential ROI Formulas Every Investor Must Know
- Advanced Metrics to Differentiate Expert Analysis
- Real-World Reality Check: Analyzing a 2025 Investment Deal
- The Property: A Typical Value-Add Opportunity
- The Real Cost of Entry: Beyond the Down Payment
- The Operating Reality: Where Your Money Actually Goes
- The Leverage Decision: Cash vs. Mortgage
- The Tax Advantage: How the Deal Actually Works
- The 5-Year Outlook: Where Real Wealth is Built
- The Exit: Where It All Comes Together
- The Lessons: What This Really Means
- What Constitutes a "Good" ROI in Today's Market?
- Leveraging Tools and Competitive Market Analysis for Higher Returns
- Summary: The Roadmap to Consistent Growth
What is ROI (Return on Investment) in Real Estate?
So what is ROI in real estate, exactly? Here’s the simplest way to think about it:
ROI measures how much money you make compared to how much money you spent.
That’s it. Seriously. It’s basically the answer to “Did I win or lose on this deal?” but in percentage form.
More technically speaking, ROI is the ratio between your profits and your costs, showing you how much money you made as a percentage of your total investment. If you put $100,000 into a property and made $10,000 in profit, your ROI would be 10%. Not too shabby, right?
But here’s where it gets interesting – and why this metric is so crucial. ROI lets you:
- Evaluate profitability: Is this property actually making you money, or is it just eating your cash?
- Compare opportunities: Should you buy that duplex downtown or the single-family home in the suburbs? ROI helps you decide.
- Make informed decisions: No more gut feelings or “it seems like a good deal.” You’ll have actual numbers backing you up.
The core purpose? It’s your reality check. It keeps you honest about whether a deal is actually worthwhile or if you’re just in love with the idea of owning property (which, been there, done that, bought the overpriced T-shirt).
Why Traditional ROI Formulas Fall Short in Real Estate

Okay, here’s where things get a bit messy. You might think you can just plug numbers into a basic ROI formula and call it a day. But real estate? It’s not that simple. Sorry.
Unlike buying stocks or bonds, real estate investments come with a million moving parts. We’re talking about:
- Financing methods (cash vs. mortgage)
- Operating costs (insurance, property taxes, HOA fees)
- Maintenance and repairs (because pipes always burst at the worst possible time)
- Potential vacancies (tenants move out, properties sit empty)
- Property management fees
- Utility costs
- Capital expenditures
See what I mean? It’s like trying to calculate the cost of a road trip when you don’t know the gas prices, toll fees, or how many times you’ll stop for overpriced coffee.
And here’s the kicker – the way you finance your property completely changes how you should calculate ROI. An investor who bought a property in cash and one who used a mortgage can’t use the same formula and expect accurate results. It’s like comparing apples to, I don’t know, orange-flavored apples? They’re different, is my point.
That’s why we need multiple formulas. Because one size definitely doesn’t fit all in real estate.
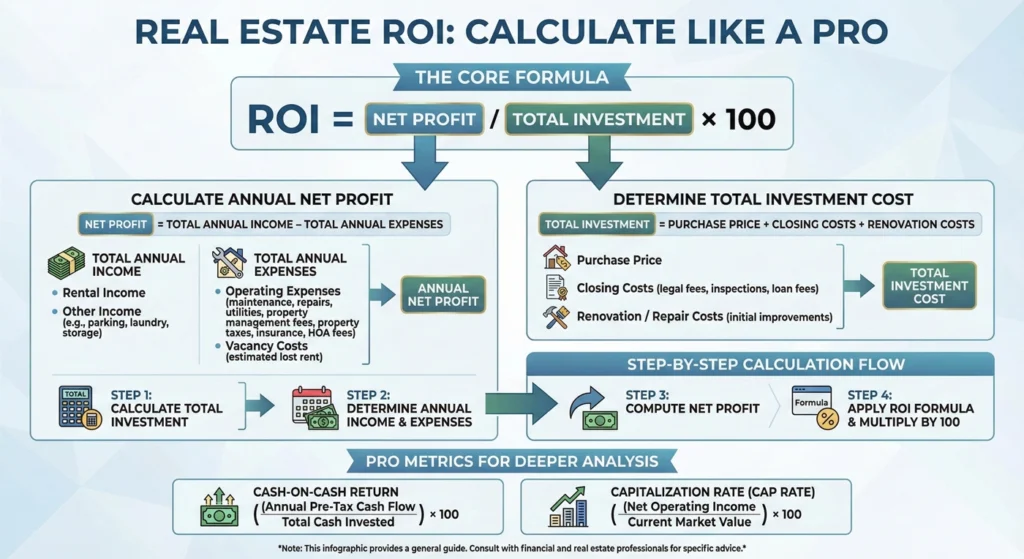
The 3 Essential ROI Formulas Every Investor Must Know
Alright, let’s get into the good stuff. These are the three formulas you absolutely need to have in your back pocket. Don’t worry – I’ll break them down so they actually make sense.
Formula 1: Simple ROI (The General View)
This is your basic, bird’s-eye view of how your property is performing. It’s the 30,000-foot perspective that tells you whether your investment is working overall.
Purpose: This formula shows you how well your property is performing by dividing your annual returns by your total investment (and yes, that includes both the cash you put in and any money you borrowed).
The Formula:
ROI=Total InvestmentAnnual Return×100%
Simple enough, right? Let’s say you bought a property for $200,000 and it generates $20,000 in profit per year. Your ROI would be 10%.
This formula is great for getting a quick sense of your returns, but it’s pretty basic. Think of it as the “getting to know you” formula – helpful for first impressions, but you’ll want to dig deeper.
Formula 2: Cap Rate (For All-Cash Purchases)
If you paid cash for your property (look at you, money bags!), the cap rate is your best friend. This one’s specifically designed for properties purchased without financing.
What it is: Cap rate measures your rental property’s profitability by calculating the ratio between its Net Operating Income (NOI) and the purchase price.
Now, to calculate cap rate, you first need to figure out your NOI. That means taking your rental income and subtracting all your operating expenses – but NOT your mortgage payment (since you don’t have one in this scenario).
The Formula:
Cap Rate=Purchase PriceNet Operating Income×100%
Here’s an example: You bought a property for $300,000 cash. It generates $30,000 in annual rent. After paying $12,000 in operating expenses (taxes, insurance, maintenance, etc.), your NOI is $18,000.
Your cap rate? $18,000 ÷ $300,000 = 6%
Cap rate is fantastic for comparing different properties in the same market. If one property has a 7% cap rate and another has a 4% cap rate, you can quickly see which one’s the better performer.
Formula 3: Cash-on-Cash Return (For Financed Transactions)
This is where things get interesting – and where most of us actually operate, since not everyone has a few hundred thousand in cash lying around (if you do, we should be friends).
Purpose: Cash-on-cash return considers leverage (your mortgage) and measures returns based only on the actual cash you physically put into the deal. That means your down payment, closing costs, and any rehab money.
This formula uses your annual cash flow, which is your NOI minus your mortgage payments (also called debt service).
The Formula:
Cash-on-Cash Return=Total Cash InvestedAnnual Cash Flow×100%
Let me break this down with a real example. Say you:
- Put 20% down on a $250,000 property ($50,000)
- Paid $5,000 in closing costs
- Spent $10,000 on repairs
- Total cash invested: $65,000
Your property generates $24,000 in annual rent and has $9,000 in operating expenses (NOI = $15,000). Your mortgage payment is $12,000 per year. So your annual cash flow is $3,000.
Your cash-on-cash return? $3,000 ÷ $65,000 = 4.6%
This formula is super important because it shows you the real return on YOUR money, not the bank’s money. And that’s what actually matters at the end of the day.
Advanced Metrics to Differentiate Expert Analysis
Okay, you’ve got the basics down. But if you want to think like the pros, these advanced metrics are where the magic happens.
Beyond Cap Rate: Sophisticated Metrics for Real Estate Investment
Ready to level up? These metrics separate the beginners from the experts.
Cash Flow: The True Measure of Investment Health
If there’s one metric that keeps investors up at night (in a good way or a bad way), it’s cash flow.
What it is: Cash flow is what’s left of your Net Operating Income after you subtract your mortgage payments. It’s the actual money hitting your bank account every month.
Here’s why this matters so much: Cash flow is the single most important metric for long-term investments. It reflects whether your property can actually generate passive income or if it’s just slowly draining your wallet.
The Formula:
Cash Flow=NOI−Debt Service
Positive cash flow means money in your pocket. Negative cash flow means you’re paying to own the property (which sometimes makes sense for appreciation plays, but that’s a whole other conversation).
Pro tip: Always aim for positive cash flow. Those “it’ll appreciate later” deals can bite you if the market turns. Cash flow keeps the lights on while you wait for the big payoff.
Internal Rate of Return (IRR): Measuring Multi-Year Value
Alright, this one’s for the sophisticated investors out there. IRR is like ROI’s smarter, more complicated cousin who went to business school.
Purpose: IRR tracks your investment returns over multiple years, factoring in all the ins and outs – remodel costs, annual cash flow, and your eventual sale profits.
Think of it this way: Simple ROI gives you a snapshot. IRR gives you the whole movie.
This metric is crucial if you’re looking at syndications, planning to hold properties for several years, or want to understand the true long-term value of your investment. It’s complicated to calculate by hand (thank goodness for calculators and Excel), but it gives you the most accurate picture of your returns over time.
Debt Service Coverage Ratio (DSCR): Understanding Your Lender
Here’s a fun fact: Your lender cares a lot about DSCR, even if you’ve never heard of it.
Purpose: DSCR is a ratio that shows how easily you can make your mortgage payments. Basically, it tells the bank whether you’re a good bet or a risky one.
The Formula:
DSCR=Monthly Debt ServiceMonthly NOI
A DSCR of 1.0 means your property generates exactly enough income to cover your mortgage – which is cutting it way too close for comfort. Most lenders want to see a minimum of 1.2, meaning your property generates 20% more income than needed to cover the mortgage payment.
The higher your DSCR, the more “wiggle room” you have, and the happier your lender will be. Plus, a good DSCR means you’re not one bad month away from disaster.
Real-World Reality Check: Analyzing a 2025 Investment Deal
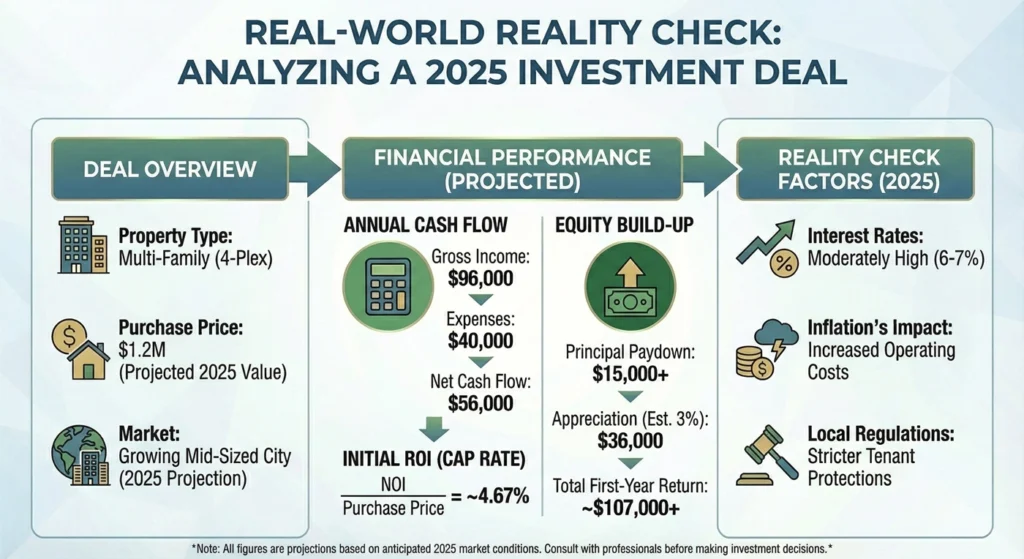
Okay, we’ve covered the formulas and metrics. Now let’s see how this actually works in the real world – because theory is great, but reality has a way of throwing curveballs.
I’m going to walk you through a detailed case study of a typical value-add single-family rental property in the Midwest market (think Indianapolis or similar stabilizing markets). Why the Midwest? Because unlike the volatile Sun Belt markets dealing with oversupply, or the extremely expensive coastal markets, this represents where many investors can actually find deals that pencil out in 2025.
Fair warning: This gets into the nitty-gritty. But if you’re serious about real estate investing, this is exactly the kind of analysis you need to do before signing anything.
The Property: A Typical Value-Add Opportunity
Here’s what we’re working with:
- Property Type: Single-family residence, 3 bed/2 bath
- Condition: Structurally sound but cosmetically dated (built in the 1990s, needs updating)
- Purchase Price: $300,000
- Current Rent: $2,200/month (below market because of condition)
- After-Reno Rent: $2,600/month (at market rate)
- Property Taxes: 1.2% annually ($3,600/year)
- Insurance: $1,200/year (Midwest rates are thankfully more reasonable than coastal)
This is a “light value-add” deal – not a gut job, but needs flooring, paint, updated fixtures, and some cosmetic love to command top-of-market rents.
The Real Cost of Entry: Beyond the Down Payment
Here’s where most beginners mess up their calculations – they forget that buying a property costs way more than just the down payment. Let’s break down the actual cash you need:
| Cost Item | Amount | Notes |
|---|---|---|
| Purchase Price | $300,000 | |
| Down Payment (25%) | $75,000 | Standard for investment property |
| Loan Origination (2 points) | $4,500 | 2% of the $225k loan |
| Appraisal & Inspection | $1,200 | Standard due diligence |
| Title & Insurance | $1,800 | Protects your ownership |
| Recording & Transfer Fees | $800 | Lower in Indiana vs. expensive states |
| Prepaid Escrow | $1,500 | 3-4 months of taxes/insurance |
| Renovation Budget | $25,000 | Flooring, paint, fixtures |
| Total Cash Required | $109,800 | This is your real investment |
See what happened there? You thought you needed $75,000 (the down payment), but you actually need $109,800 to close and stabilize this property. This is why so many new investors run out of cash – they underestimate the entry cost.
The Operating Reality: Where Your Money Actually Goes
Now let’s talk about what it costs to actually run this property. And spoiler alert: it’s more than most people budget for.
After renovations, the property rents for 2,600/month (\31,200 annually). But you don’t get to keep all of that. Not even close.
| Expense Category | Monthly | Annual | % of Rent | Notes |
|---|---|---|---|---|
| Gross Rent | $2,600 | $31,200 | 100% | Post-renovation market rate |
| Vacancy Loss (7%) | -$182 | -$2,184 | 7% | National average for 2025 |
| Effective Income | $2,418 | $29,016 | 93% | What you actually collect |
| Property Management | -$260 | -$3,120 | 10% | Professional management fee |
| Property Taxes | -$300 | -$3,600 | 11.5% | 1.2% of property value |
| Insurance | -$100 | -$1,200 | 3.8% | Rising but manageable in Midwest |
| Maintenance | -$375 | -$4,500 | 14.4% | 1.5% of property value annually |
| CapEx Reserve | -$130 | -$1,560 | 5% | Roof, HVAC, major repairs |
| Total Expenses | -$1,165 | -$13,980 | 44.8% | |
| Net Operating Income | $1,253 | $15,036 | 48.2% | What’s left before mortgage |
Reality check: That 44.8% Operating Expense Ratio might seem high if you’ve been reading overly optimistic blog posts claiming 20-30% expenses. But in 2025, with proper management fees, rising insurance costs, and realistic maintenance budgets, 40-50% is actually the norm for single-family rentals.
If you’re underestimating expenses in your calculations, you’re setting yourself up for disappointment (or worse, negative cash flow surprises).
The Leverage Decision: Cash vs. Mortgage
Now here’s where it gets really interesting – and where we see the impact of the 2025 interest rate environment.
Scenario A: The Leveraged Purchase (25% Down)
Let’s say you finance this deal with a typical investment property loan:
- Loan Amount: $225,000
- Interest Rate: 7.0% (30-year fixed)
- Monthly Payment: $1,497
- Annual Debt Service: $17,964
Now let’s calculate your cash flow:
Annual Cash Flow = NOI – Debt Service
Annual Cash Flow = $15,036 – 17,964 = -\2,928
Wait, what? Negative cash flow?
Cash-on-Cash Return = -$2,928 ÷ $109,800 = -2.67%
Yep. Despite doing everything “right” – buying below market, adding value, raising rents – this property loses money every single month if you finance it.
This is what’s called negative leverage, and it’s the harsh reality of the 2025 market. When mortgage rates (7%) exceed the property’s cap rate (around 5%), leverage actually hurts your returns instead of helping them.
Scenario B: The All-Cash Purchase
Now let’s see what happens if you pay cash:
- Total Cash Invested: $330,000 (purchase + closing + renovation)
- Annual Cash Flow: $15,036 (same as NOI, no debt service)
- Cash-on-Cash Return: $15,036 ÷ $330,000 = 4.56%
Better! At least it’s positive. But 4.56% isn’t exactly exciting when high-yield savings accounts are paying similar rates with zero risk and complete liquidity.
So is this deal dead? Not quite. This is where the magic of real estate tax benefits comes in.
The Tax Advantage: How the Deal Actually Works
Here’s the secret sauce that makes real estate investing still viable in 2025: depreciation and tax benefits.
For property acquired in 2025, you can use 100% bonus depreciation on certain components through a cost segregation study. Here’s how this plays out:
Standard Depreciation:
- Building value (80% of purchase): $240,000
- Standard annual deduction: $8,727 (over 27.5 years)
With Cost Segregation & Bonus Depreciation:
- Renovation costs (100% deductible): $25,000
- Segregated building components (20%): $48,000
- Total first-year depreciation: ~$79,000
If you’re a high earner in the 35% tax bracket who qualifies to use these losses (either as a Real Estate Professional or through the Short-Term Rental loophole):
Tax Savings = $79,000 × 35% = $27,650
Now let’s recalculate the leveraged scenario:
- Operational Cash Flow: -$2,928
- Tax Savings (cash equivalent): +$27,650
- Net First-Year Benefit: +$24,722
After-Tax Cash-on-Cash Return = $24,722 ÷ $109,800 = 22.5%
Now we’re talking! This is why high-net-worth individuals continue buying real estate even in a negative leverage environment. The deal looks terrible on paper (-2.67%) but phenomenal after taxes (22.5%) – if you can actually use the tax deductions.
Important caveat: Not everyone can utilize these tax benefits. If you’re a W-2 employee who doesn’t qualify as a Real Estate Professional and the property isn’t a short-term rental, these losses might be “passive” and unable to offset your regular income. Talk to a CPA before banking on these tax benefits.
The 5-Year Outlook: Where Real Wealth is Built
Real estate isn’t a one-year game. Let’s see what happens if you hold this property for five years with these assumptions:
- Appreciation: 3% annually (conservative for stabilizing markets)
- Rent Growth: 2.5% annually (slightly above inflation)
- Expense Growth: 3% annually (insurance and maintenance costs rising)
Here’s how the numbers play out for the leveraged scenario:
| Year | Property Value | Loan Balance | Equity | Annual Cash Flow | Cumulative CF |
|---|---|---|---|---|---|
| Start | $325,000 | $225,000 | $100,000 | – | – |
| 2026 | $334,750 | $222,600 | $112,150 | -$2,553 | -$2,553 |
| 2027 | $344,792 | $220,030 | $124,762 | -$2,168 | -$4,721 |
| 2028 | $355,136 | $217,280 | $137,856 | -$1,774 | -$6,495 |
| 2029 | $365,790 | $214,340 | $151,450 | -$1,370 | -$7,865 |
| 2030 | $376,764 | $211,190 | $165,574 | -$956 | -$8,821 |
Notice something? Every single year shows negative cash flow. You’d need to feed this property about $1,800/year on average to keep it afloat.
But look at what’s happening with equity. By slowly paying down the mortgage (amortization) and with modest appreciation, you’ve built $65,574 in equity over five years.
The Exit: Where It All Comes Together
Let’s say you sell at the end of 2030:
- Sale Price: $376,764
- Selling Costs (6%): -$22,606 (agent commissions, closing)
- Loan Payoff: -$211,190
- Net Proceeds: $142,968
Now let’s calculate your total return:
- Net Proceeds: $142,968
- Less Initial Investment: -$109,800
- Less Cumulative Operating Losses: -$8,821
- Plus Year 1 Tax Savings: +$27,650
- Total Profit: ~$52,000
Return Multiple: 1.47x your money
Average Annual Return: ~9.4%
So despite losing money every single year on operations, you still achieved a ~9.4% annual return through the combination of:
- Amortization (debt paydown)
- Appreciation (property value increase)
- Tax Benefits (depreciation deductions)
The Lessons: What This Really Means
This case study reveals several crucial truths about 2025 real estate investing:
1. Cash flow isn’t everything – but you need to be able to afford the negative carry if cash flow is negative.
2. You can’t judge a deal by Year 1 alone – real estate wealth builds slowly, then compounds.
3. Tax benefits are critical – without them, many 2025 deals don’t work. Make sure you can actually use them.
4. This is wealth accumulation, not income replacement – if you need cash flow today to pay your bills, this deal doesn’t work for you.
5. The easy money era is over – success now requires operational excellence, not just financial engineering.
6. Location still matters enormously – this Midwest deal is stable but modest. High-growth markets offer different risk/return profiles.
The investor who succeeds in the 2025-2030 cycle is patient, well-capitalized, tax-strategic, and focused on the long game. They understand that real estate isn’t a get-rich-quick scheme – it’s a get-wealthy-reliably strategy that requires both financial sophistication and the ability to feed properties through the early years while wealth builds beneath the surface.
If that sounds like you, then deals like this – despite the scary negative cash flow – might actually be perfect for building long-term wealth.
What Constitutes a “Good” ROI in Today’s Market?
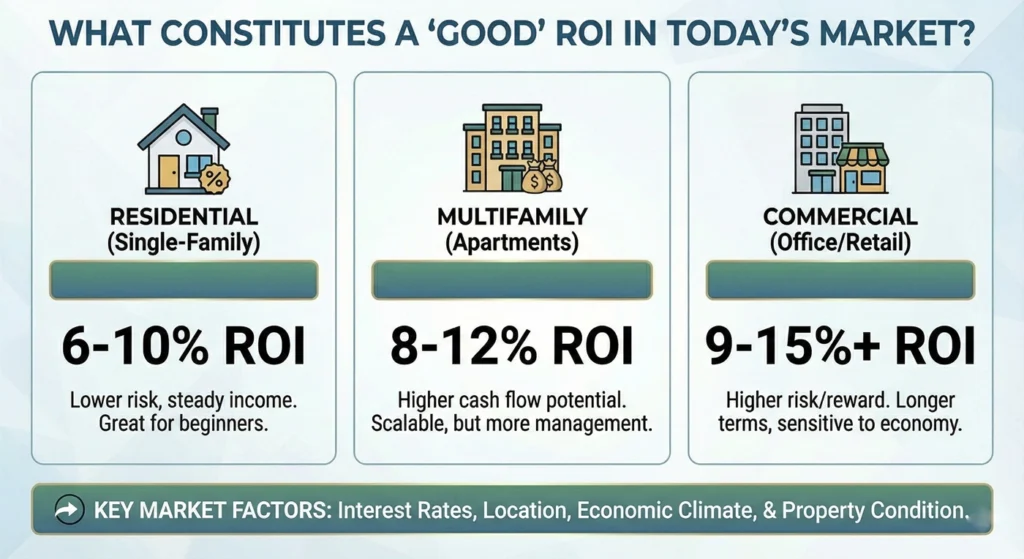
Okay, so you can calculate all these numbers. But what numbers should you actually be aiming for? Great question.
Setting Realistic Targets: Benchmarks and Variables
Here’s the honest truth: “good” ROI depends on who you ask and what market you’re in. But let me give you some general ballparks that most investors use:
Overall ROI: Most investors are happy with anything between 8% to 12%. If you’re hitting 15% or higher? You’re crushing it.
Good Cap Rate (for cash purchases): Experts generally look for anywhere from 4% to 10%. In hot markets like Los Angeles or San Francisco, even 4% might be considered solid. In emerging markets or the Midwest, you might find 10%+ deals.
Good Cash-on-Cash Return (for financed deals): Most investors aim for 8% to 12%. Anything higher is gravy.
But – and this is important – these numbers aren’t carved in stone. They’re guidelines, not rules.
Key Factors Influencing Your Target ROI
What makes a “good” ROI really depends on a few key factors:
Financing Method: This is huge. Using leverage (a mortgage) often results in a higher ROI percentage, even though your actual monthly cash flow might be lower. It’s the power of using other people’s money (thanks, banks!).
Location and Market: Returns vary dramatically depending on where you invest. A property in downtown LA might have a 4% cap rate but massive appreciation potential. A property in Cleveland might have a 10% cap rate but slower appreciation. Different strokes for different folks.
You need to understand your local rental market – and honestly, sometimes you need to understand it block by block. The rental income and property values can vary wildly even between neighborhoods.
Investment Goal: What are you trying to achieve? Are you building a cash flow machine for retirement? Looking for appreciation plays? Building equity? Your definition of “good” should align with your goals.
Some investors are totally fine with breaking even on cash flow if they’re banking on appreciation and equity buildup. Others (like me) sleep better at night with solid positive cash flow every month.
Leveraging Tools and Competitive Market Analysis for Higher Returns
Let’s be honest: Calculating real estate ROI by hand is about as fun as doing your taxes. Thankfully, we live in the future, and there are tools that make this so much easier.
Calculating ROI in Minutes: The Investor’s Toolkit
Why tools matter: Using a real estate ROI calculator and specialized software ensures accuracy and saves you time. Plus, these tools can automatically recalculate your numbers when you adjust financing details, which is clutch when you’re running different scenarios.
Here are some essential calculators that’ll boost your confidence:
Rental Property ROI Calculator: These are all over the internet (many are free). They let you plug in your numbers and instantly see your returns. No math degree required.
Rental Property Calculator: These more comprehensive tools help you analyze entire deals, factoring in everything from vacancy rates to property appreciation.
Rent Estimator: Crucial for setting optimized rental income. You can’t calculate accurate returns if you don’t know what you can realistically charge for rent.
Deal Analyzer Spreadsheet: Many investors create their own in Excel or Google Sheets. Once you set it up, you can analyze properties in minutes.
Some popular software options include:
- Mashvisor (great for predictive analytics)
- Landlord Studio (solid all-around property management)
- BiggerPockets calculators (free and investor-friendly)
- RentRedi
- Stessa
Property Management Software: This might seem unrelated, but hear me out. Good property management software helps you track ongoing operating costs and expenses in real-time. And accurate expense tracking? That’s crucial for calculating your actual ROI.
There’s nothing worse than thinking you’re making 10% returns only to realize you forgot to factor in the $5,000 you spent on repairs.
Conducting Competitive Market Analysis (CMA) to Outperform the Competition
If you want to consistently find good deals, you need to master the Competitive Market Analysis (CMA). This is how you make sure you’re not overpaying for properties or setting unrealistic rent expectations.
Why CMA is necessary: A solid CMA helps you determine a reasonable property value, ensuring you’re paying an appropriate price and actually getting a good deal. It’s the difference between “this seems like a good price” and “I know this is a good price.”
The 6-Step Process for a Winning Edge:
- Neighborhood Analysis: Start by understanding the area. What are the average home prices? How’s the school district? Is the area improving or declining?
- Get Detailed Property Information: Know everything about the property you’re considering – square footage, bedrooms, bathrooms, condition, upgrades, etc.
- Find Comparable Properties (“comps”): Look for properties that have sold recently (within the last 3 months) within about a one-mile radius. They should be similar in size, condition, and features.
- Adjust for Differences: No two properties are exactly alike. If a comp has an extra bedroom or a renovated kitchen, adjust its value accordingly to make a fair comparison.
- Establish a Price Range: Based on your comps and adjustments, determine a reasonable price range for the property.
- Set Market Value: Use all this data to establish what the property is actually worth.
Integrating CMA and ROI: Here’s where it gets really powerful. Once you’ve done your CMA, compare your projected ROI against the cap rates and cash-on-cash returns of comparable properties. This tells you whether your deal is actually profitable or just average.
If similar properties are getting 7% cap rates and yours is projected at 5%? You might be overpaying. If yours is at 9%? You might have found a gem.
Summary: The Roadmap to Consistent Growth
Let’s bring this all home. Understanding and calculating real estate ROI isn’t just about crunching numbers – it’s about making smart, informed decisions that lead to consistent growth in your real estate portfolio.
Final Insights: Building Your Investment Strategy
Here’s the thing about real estate investing: it’s not a get-rich-quick scheme. It’s a get-rich-slowly, build-wealth-consistently strategy. And the foundation of that strategy? Treating ROI calculation and analysis as a structured, repeatable process.
Every time you look at a property, run the numbers. Every single time. No exceptions. No “but it feels right” or “I have a good feeling about this.” Good feelings don’t pay mortgages – solid math does.
Content marketing for real estate investors is often described as the “reliable front door to consistent growth.” But here’s my take: understanding your ROI metrics is the foundation that door sits on. You can’t market effectively if you don’t understand your numbers inside and out.
Trust wins deals. When you’re talking to sellers, buyers, partners, or lenders, being able to show transparent deal math builds instant credibility. Use case studies with before/after numbers. Share real examples. Get testimonials. People trust investors who know their stuff and can back it up with data.
Actionable Next Steps
Ready to put this knowledge to work? Here’s what you should do:
- Download or create a real estate ROI calculator if you don’t have one already. Seriously, do this today.
- Practice on properties: Start analyzing deals, even if you’re not ready to buy yet. It’s like going to the gym – you need reps to get good at it.
- Track your KPIs: If you already own properties, start tracking leads generated, conversion rates, and content-attributed deals. What gets measured gets improved.
- Build your toolkit: Bookmark useful calculators, sign up for property analysis tools, and maybe join a real estate investing community where you can learn from others.
- Keep learning: Markets change, interest rates fluctuate, and new strategies emerge. Stay curious and keep educating yourself.
Remember, the difference between successful real estate investors and those who struggle often comes down to one thing: discipline around the numbers. Anyone can fall in love with a property. Smart investors fall in love with the deal math.
References:
- Freddie Mac. Primary Mortgage Market Survey® (PMMS®). https://www.freddiemac.com/pmms (Use for 30-year and 15-year conventional rate context.)
- Federal Reserve Bank of St. Louis (FRED). 30-Year Fixed Rate Mortgage Average in the United States (MORTGAGE30US). https://fred.stlouisfed.org/series/MORTGAGE30US
- Consumer Financial Protection Bureau (CFPB). Ability-to-Repay and Qualified Mortgage Rule (ATR/QM) resources. https://www.consumerfinance.gov/rules-policy/final-rules/ability-to-repay-and-qualified-mortgage-rule/ (Useful background when discussing non-QM/DSCR-style lending.)
- Mortgage Bankers Association (MBA). Mortgage Finance Forecasts / Industry Surveys & Data. https://www.mba.org/news-and-research (Use for market commentary and rate/volume context; cite the specific report/issue you use.)
Rent growth, vacancies, and market conditions
- U.S. Census Bureau. Housing Vacancies and Homeownership (CPS/HVS). https://www.census.gov/housing/hvs/ (Use for national and regional rental vacancy rates.)
- Zillow Research. Zillow Observed Rent Index (ZORI) & rental market reports. https://www.zillow.com/research/ (Use for rent growth/decline by metro and national trends.)
- Apartment List Research. National Rent Report (monthly) & metro rent trends. https://www.apartmentlist.com/research/category/rent-report
- Yardi Matrix. Multifamily market reports & supply pipeline commentary. https://www.yardimatrix.com/publications/ (Useful for Sun Belt deliveries/oversupply narrative; cite the specific report.)
- RealPage. Multifamily market analytics and research publications. https://www.realpage.com/analytics/ (Use for supply/demand and rent pressure discussions; cite the specific publication.)
Operating expenses, insurance pressure, maintenance/CapEx assumptions
- U.S. Bureau of Labor Statistics (BLS). Consumer Price Index (CPI) – Shelter and housing-related series. https://www.bls.gov/cpi/ (Use for inflation backdrop affecting operating costs.)
- NYC Rent Guidelines Board. Price Index of Operating Costs (PIOC) & annual research reports. https://rentguidelinesboard.cityofnewyork.us/ (This is one of the most-cited public “operating cost index” sources; cite the specific year/report if you use PIOC figures like insurance spikes.)
- Insurance Information Institute (Triple-I). Insurance economics & property/casualty market conditions. https://www.iii.org/ (Good for explaining premium pressure drivers; cite a specific brief/report.)
- National Association of Insurance Commissioners (NAIC). Insurance industry data & reports. https://content.naic.org/ (Use for industrywide property insurance context.)
- Institute of Real Estate Management (IREM). Income/Expense Analysis Reports (by property type/region, when available). https://www.irem.org/ (Use as a benchmark reference for expense ratios; cite the specific publication/edition.)
Closing costs / transaction cost assumptions
- Bankrate. Closing costs by state (annual study/report). https://www.bankrate.com/real-estate/closing-costs/ (Use for typical closing cost ranges and state comparisons; cite the specific year.)
- ClosingCorp. National Closing Cost Report (annual). https://www.closing.com/closingcorp (Use for detailed closing-cost benchmarking; cite the edition.)
- American Land Title Association (ALTA). Consumer and industry resources on title insurance & settlement. https://www.alta.org/ (Background/definitions; cite specific resources as needed.)
Depreciation, bonus depreciation, and cost segregation (authoritative tax sources)
- Internal Revenue Service (IRS). Publication 527: Residential Rental Property. https://www.irs.gov/publications/p527
- Internal Revenue Service (IRS). Publication 946: How To Depreciate Property. https://www.irs.gov/publications/p946
- Internal Revenue Code (IRC) § 168. Accelerated Cost Recovery System (MACRS); special depreciation allowance under §168(k). (Cite via Cornell LII or official U.S. Code source.) https://www.law.cornell.edu/uscode/text/26/168
- Internal Revenue Service (IRS). Cost Segregation Audit Techniques Guide (ATG). https://www.irs.gov/businesses/cost-segregation-audit-techniques-guide (Best citation to support cost seg methodology and component lives.)
Important note for your case study text:
Your draft states that “100% bonus depreciation is restored for property acquired after January 19, 2025.” That’s a very specific effective-date claim. To keep the article accurate, cite the actual enacted law/IRS guidance for the year (and adjust wording if needed). If you can’t verify the exact effective date in published law, a safer phrasing is:
“Bonus depreciation rules have changed over time; check the current §168(k) percentage for the year the asset is placed in service.”
Home price / appreciation forecasts (for 2026–2030 assumptions)
- Realtor.com. Housing Forecast (annual). https://www.realtor.com/research/forecast/
- Zillow Research. Home Value Forecast methodology and releases. https://www.zillow.com/research/
- Fannie Mae. Economic & Housing Outlook (ESR Group). https://www.fanniemae.com/research-and-insights/forecast
- Freddie Mac. U.S. Housing Market Research & Forecasts. https://www.freddiemac.com/research
- CoreLogic. Home Price Index (HPI) and forecast reports. https://www.corelogic.com/intelligence/ (Cite specific HPI forecast release used.)
- Internal Revenue Code (IRC) § 1031. Exchange of real property held for productive use or investment. https://www.law.cornell.edu/uscode/text/26/1031
- Internal Revenue Service (IRS). Like-Kind Exchanges – Topic resources. https://www.irs.gov/businesses/small-businesses-self-employed/like-kind-exchanges-real-estate-tax-tips
- Internal Revenue Service (IRS). Publication 544: Sales and Other Dispositions of Assets. https://www.irs.gov/publications/p544 (For capital gains/recapture basics; cite relevant sections.)